Examples

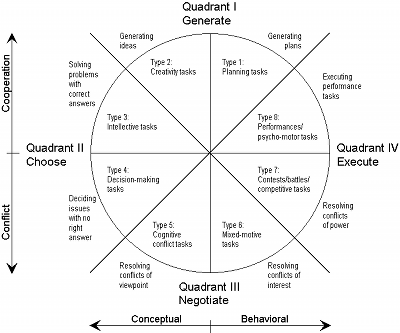
Competition versus cooperation

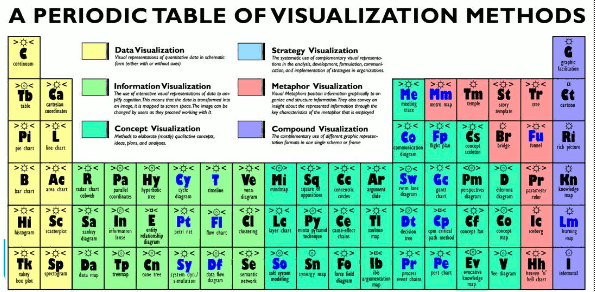
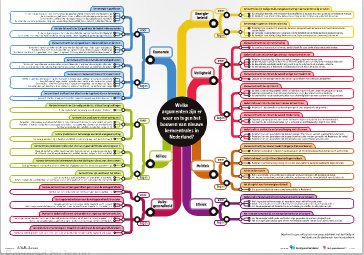
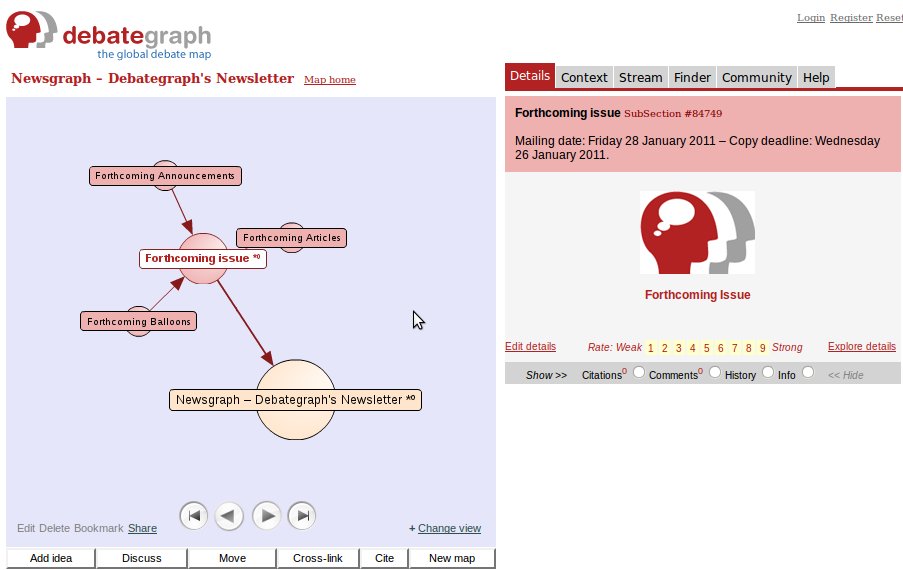
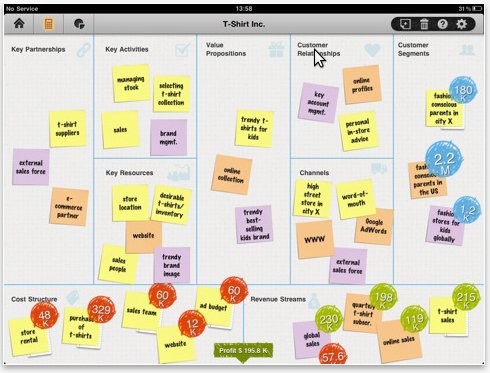
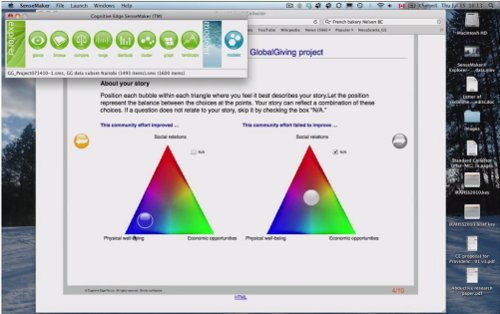
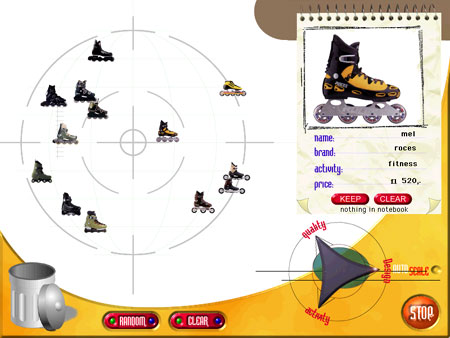
How can visualization help us grasp the nature of our complex relationships?


Conflicts of interests: about the advantage or benefit of a person or group and loyalties:

When cooperation and competition co-exist there is a conflict of interests. People differentiate their interests over different perspectives. For instance the perspective of time (a), space (b) and decision making unit (c) {aka <organisatiegrootte><zoom level>}.

Assuming the example of the three Universities of Technology (UoT’s) in the Netherlands is spot on, deeper coexisting levels appear when peeling the union of interests. In general, universities need to play parallel multi-interest games of cooperation at some levels and of competition at other levels. Let us zoom into those levels from the perspective of the UoT.

(a) Differentiation over time:

  • Level of perceived history. Just like Delft and pottery go hand in hand since 1650, also Eindhoven and Philips do since 1891. Upon today the history of traditions and industry, still reflects upon the reputation and therefore the perceived value of each University.

  • Level of short term goals. Each year all UoT’s are competing in attracting enough students and in attracting the best students, to secure financial needs and stimulate growth.

  • Level of long term goals. All three UoT’s have joined forces in the 3TU.Federation, focusing on two main aims: Facilitation & Standardization and shared services. This is a high performing kickoff to boost efficiency, together with a high reliability strategy increasing (inter)national effectiveness.

  • Level of timing (1): It seems easier to collaborate with other universities that are in the same stage of development, resulting in new institutes like the School for Technology Design; the Sten Ackerman Institute.

  • Level of timing (2): Deploying one strategy seems fruitfull to time commitments and recources. For example, the Delft University could merge with two other dutch technical universities and / or could also merge with two other non-technical universities, more or less planned in the same timeframe. 

  • Level of timing (3): Sometimes governmental decision making is synchronous to operational or strategic activities. Sometimes it is not in sync. It then disrupts planned developments or recently activated activities.

Differentiation over time asks us: How to deal with interests that are labeled with a time perspective, when -at the same time- acting on interfering interests that are based other time perspectives?


(b) Differentiation over space <zoom level of a system>:

  • Level of location: Every University is developing it’s own campus. Local, regional and national government play their roles in the development of housing, public transport, infrastructure, business parks e.g.

  • Level of sources: Approximately until 2000 all 3 UoT’s were strongly competing for sources (students, funding). Today, the organizations are learning to align their activities and to combine their sources. By doing so they start strengthening the collaborative impact across national borders, not only within Europe but also world wide.

  • Level of borders: Valorization Centers of the UoT’s may have regional oriented business goals in collaboration with public regional interests, conflicting with the intended cooperation of 3TU.Federation.

  • Level of reach: Delft is not only aligning with other dutch technical universities on a national level, but also with other regional non-technical universities on a regional level (Leiden+Rotterdam). Both for reaching out to attract foreign talent and growth perspectives, from an international perspective.

Differentiation over space asks us: How to deal with interests that originate from within one region, when -at the same time- acting on interfering interests outside that region?


(c) Differentiation over <organisatie grootte> decision making unit:

  • Level of the individual: The interests of a Rector Magnificus may differ from those of a library employee or a student. They may however share an individual sense of pride or loyalty belonging to the same group.

  • Level of the individuals: Due to a bachelor/master system, students themselves can find best fitting paths. Standardization needs cooperation, but in this case also leads to new competition.

  • Level of a group / team: Within a board of decision makers, there is a delicate balance between agreement on some issues and disagreement on others.

  • Level of a Group / organization: Within each university different service departments or faculties could experience internal competition. This can lead to civil service resistance within an organization during – for example – reorganization.

  • Level of a GROUP / : Does the organizational model still fit todays organization, for instance when collaboration with self employed persons becomes standard practice or when the lifespan of research outlives public or commercial principals or assignments?

Differentiation over decision making unit asks us: How to deal with interests loyal to one group level, when -at the same time- acting on interfering interests at different group levels?


The examples describing the differentiation of interests tend to overlap now and then. They all deal with history, context and dynamics of a group. All levels of differentiation ask us how to deal with interfering interests and conflicting loyalties.
NOTE: read more about this example: background insights (here) and additional developments (here, last two paragraphs).

Does sharing these interests support Group decision making? And if so, how can we prioritize these interests of individuals and groups and how can we communicate these priorities of interests?

Facebooktwitterlinkedinmail

Visual deliberation: Playing it close to the chest

There are several tools/ methods/ techniques delivering visual support for decision making. A nice overview is this periodic table of visualization.

periodic_table

There are visuals that unravel arguments by using diagrams, and those that combine arguments by embedding them in a story. In my opinion, both types can help both explain and fend of arguments.
Let’s examine a some diagram types, as a warming up before discussing the potentional and impact of working with visualizations in complex situations.

The method of argument mapping (i.e. De argumenten kaart) delivers a visual overview using lists framed within the limits of an A3-paper.

argumentenkaart

Relations between arguments stay unclear. The tooling of debategraph tries to make these relations comprehensible by adding some interactivity, for instance by using different views of the same information.

debategraph

So when are we talking about argument infographics and when about argument maps? This is what Tim van Gelder mentions at his blog.

Another example, using a fixed layout, is the business model canvas based on The Business Model Ontology – A Proposition In A Design Science Approach. Available for ipad as well. Nice first steps.Unfortunately no support for realtime collaboration, yet.

bmc_ipad

A well known visual narrative example (although there is not really a beginning, plot or ending) is this (mis)management story from projectcartoon:

projects

What is really interesting, is the option to create your own version of the story.

So, now we have seen some visual examples to be used in complicated or complex situation and support decision making. Are these really useful in group interaction?
After watching this episode of Goudzoekers (‘golddiggers’), I learned about Bent Flyvbjerg, a researcher in cost overruns and benefit shortfalls at Oxford University, who offers two reasons for major estimates (dutch: ‘kostenoverschrijding’) in construction projects: (1) human optimism & (2) deliberate misinterpretation/misrepresentation (aka lying).

Knowing that during negotiations in complex situations neither group will be sincere about the intention, because of the unspoken interests of each group or of an individual within that group, it is still questionable that visualizations will help and reduce the ‘leak of energy‘. Both in the short and long run, the individual gains and need for control make people play it pretty close to the chest.

It seems that we talk too much, or at least a lot and most of the times not anout the right stuff: our interests or intentions. In complex situations -where cooperation and competition are in delicate balance- we tend to go around the subject, whether we do this intentionally (because of hidden interests) or not (because of the lack of analytical and communicative capacity). Or perhaps both…

In my proposal I mention ‘whether unexpected, seemingly random and emotionally disturbing developments can improve the cooperation of the whole’. It would be interesting to find out (a) if visualizing ‘hidden interests’ makes a group lower its ‘lack of capacity’ and (b) if visualizing ‘lack of capacity’ enables groups to extract ‘hidden interests’.
Although the examples above are more or less content driven, the balance between complexity and cooperation is also about intention. About a ambition and loyalty. About personal motives close to the chest. About trying to make people explain these motives. About trying to become more effective.

Facebooktwitterlinkedinmail

Feynman Diagram

Neither in Sketching at work, nor in A periodic table of visual methods I can find a relation with the Feynman Diagram:

@Xner, if you’re out there, please enlighten me!

Facebooktwitterlinkedinmail

Wubbo Okkels

NRC Weekend, zaterdag 14 mei & zondag 15 mei, 2011. Tekst: Gijsbert van Es.

… ex-astronaut Wubbo … hoogleraar in Delft: “voor mij is de oogsttijd aangebroken”.

… “binnen een half jaar had ik een consortium gevormd… we presenteerden een plan… wat was de reactie? Het is een integraal plan en dus: te ingewikkeld. Niet eens te duur, nee: te complex.
Want veiligheid: daarover gaat Rijkswaterstaat. Energie: dat is van Economische Zaken. Duurzame energie: weer een ander clubje amtenaren. Natuur, recreatie: idem.
In Nederland heerst bestuurlijk onvermogen om grootse projecten te managen.”

Spot on, Wubbo! Except for the fact that (1) most civil servants and most decision makers don’t like having a target on their heads and (2) if government can’t manage big complex projects, perhaps the question is ‘What exactly withholds such a consortium to find a public (or private) project owner?’ … of course, if more organisations feeel related to an issue, less organisations feel fully responsible.
Could it be that public decision makers have different agenda’s which they balance as a zero-sum game for the group and a win-or-loose game for individual, personal careers and more intimate group relations?

…”Dit kan ook weer zo’n geweldig export product zijn. Maar net als bij de Superbus kost het me een hoop energie om het bedrijfsleven hiervoor te interesseren.
Wij Nederlanders zijn een volk van koopmannen. Wij handelen het liefst in bestaand spul – lekker veilig. Onze handelsgeest zit onze innovatiekracht in de weg”

… “Hier in Delft heerst de sfeer die W.F. Hermans beschrijft in ‘Onder professoren’. Jaloezie, trucjes, achterklap.
Het probleem zit niet zozeer aan de top. Met het collega van bestuur heb ik een uitstekende relatie.Met de collega-hoogleraren loopt het meestal ook wel.

…De stagnatie zit op het niveau daar onder en bij de ondersteunende diensten. … De bureaucratie moet op het geld, contracten en andere regeltjes letten en is dus per definitie gericht op beheren en beheersen.
In de cultuur van een universiteit is dat volledig doorgeslagen: ondersteunende diensten zijn aandacht vragende en energie vretende diensten. Ik zal er nooit aan wennen.”

Wow.

It seems that we can add an additional dimension perpendicular to cooperation and competition: direct vs long term impact.

I mostly agree with Wubbo. I do believe we need to develop something to better guide decision makers in complex situations.
What’s in the breathing gap in between comfort zone and no-go area’s? Interactive visual feedback.

Facebooktwitterlinkedinmail

Is our problem one or two dimensional?

In his lecture ‘Introduction of group dynamics‘ of Forsyth’s Group Dynamics Page (University of Richmond), he suggests two dimensions: conflict vs cooperation & conceptual vs behavioral:

McGrath’s Taxonomy of Group Tasks is based on 2 key dimensions: Choosing vs. Executing (Doing) and Generating vs. Negotiating

mcgrath_scaled

If complete, we should be able to map these tasks/dimensions onto daily used ones…

Let’s compare this with the operational/tactical PDCA cycle. Assuming there is a relation with a plan-do-check-act cycle, McGrath’s dimensions could be mapped into the PDCA cycle as generate-execute-negotiate-choose. This assumption would indicate that decision making is not behaviorial at all and is always conceptual.

Let’s abandon the previous exercize and take the strategic OODA loop into account: observe-orient-decide-act. McGrath’s dimensions could be mapped into the OODA cycle as … Well it can’t. There is no task defined which could be translated into ‘observe’. Let’s cheat, just to complete this exercise: x-negotiate-choose-execute.

Of course, models are models and not reality. We cannot really integrate them, although that leads to another question: what if we were not able to stretch our internalized, favorite models when working in complex situations?

Facebooktwitterlinkedinmail

Prof. Martin Eppler on Visualizing Knowledge for Management RoCCunisg

Found me a giant for the visualization part… One question that pops up is ‘so what’s handy when dealing with complex situations’, and at the same time taking cooperation with(in) vs competition between groups/individuals into account?

Eppler: “Not only the productivity of teams using visualisations software was significantly higher, but also the quality of their work was higher… {although they do not perceive the difference (source, 5.1 Findings)}. Even more so, on an individual basis, the recall and knowledge gains that we tested were much higher in the visualization supported software groups than in the flip chart groups”.

theoretical_bg

some articles

A guide to usability dimensions (which visualization to use when …)

Facebooktwitterlinkedinmail

Cynefin framework

A nice framework: Cynefin, published in Harvard BReview (by David J. Snowden and Mary E. Bone, 2007).

In complex situations -“where cause and effect are in hindsight” – probing, sensing (sense making) and responding successively lead to emergent practice. Emergent practice is not the same as novel practice (chaotic situations), best practice (complicated situations) or good practice (simple situations).

Assessing and recognizing the type of situation should help choose your next activity, responding from a disorderly situation:
* Sensing -> Categorizing/Analizing… (from simple/complicated situation to best/good practice)
* Probing -> Sensing … (from complex situation to emergent practice)
* Acting -> Sensing … (from chaotic situation to novel practice)

A slightly adapted perspective on the same framework can be watched here, envisioning a consecutive process, a loop of ‘maturity’ through all situations.

A related ‘sensemaking toolkit’ can be found here. Using a visual reference approach to probe stories without an intermediate expert. Useful for probing large amounts of stories and obtaining respondents’ values. About feedback to the respondents themselves I have not found any clue yet…

sensemaking_toolkit

Similar visualization is used in MDSI by Stappers and Pasman as an interactive visual dialogue technique.

MDSIProtoSkates

Facebooktwitterlinkedinmail

Visual thinking and sensemaking

These guys are stuck with each other but are not identical. Briljant case of sensemaking and feedback, although not very complex…

2headed

Facebooktwitterlinkedinmail

Why Published Research Findings Are Often False

This Slashdot article (based on an article in the Newyorker) is asking some interesting questions about scientific publications. The readers comments suggest different types of reciprocity …

Jonah Lehrer has an interesting article in the New Yorker reporting that all sorts of well-established, multiply confirmed findings in science have started to look increasingly uncertain as they cannot be replicated …

… According to John Ioannidis, author of Why Most Published Research Findings Are False, the main problem is that too many researchers engage in what he calls ‘significance chasing,’ …

I recommend reading the comments of the slashdot readers…

Facebooktwitterlinkedinmail