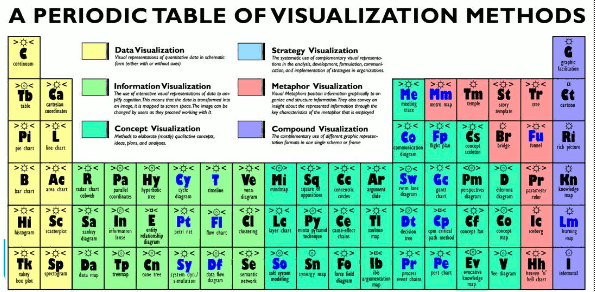
There are several tools/ methods/ techniques delivering visual support for decision making. A nice overview is this periodic table of visualization.
There are visuals that unravel arguments by using diagrams, and those that combine arguments by embedding them in a story. In my opinion, both types can help both explain and fend of arguments.
Let’s examine a some diagram types, as a warming up before discussing the potentional and impact of working with visualizations in complex situations.
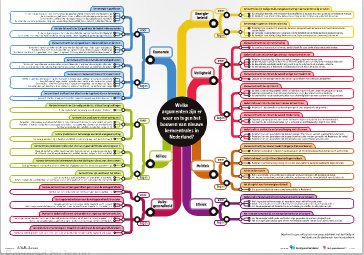
The method of argument mapping (i.e. De argumenten kaart) delivers a visual overview using lists framed within the limits of an A3-paper.
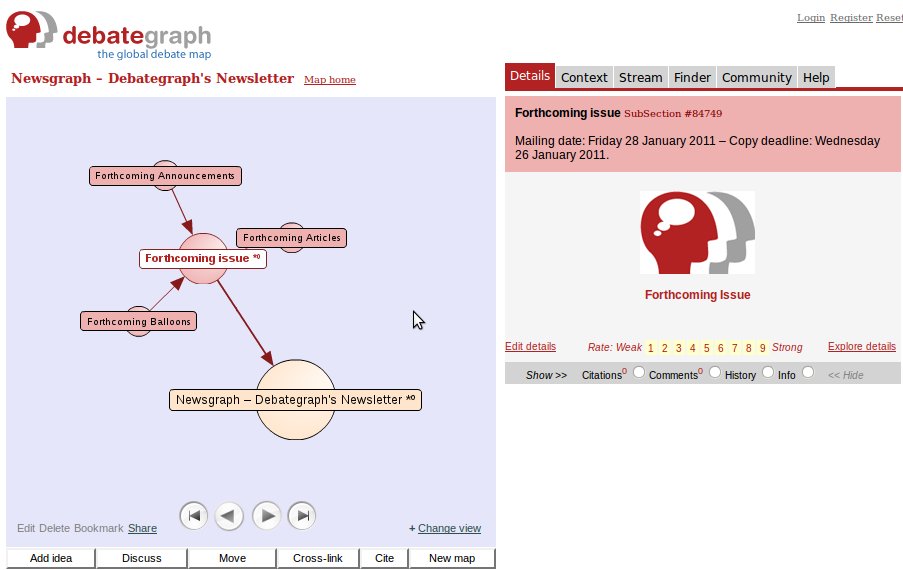
Relations between arguments stay unclear. The tooling of debategraph tries to make these relations comprehensible by adding some interactivity, for instance by using different views of the same information.
So when are we talking about argument infographics and when about argument maps? This is what Tim van Gelder mentions at his blog.
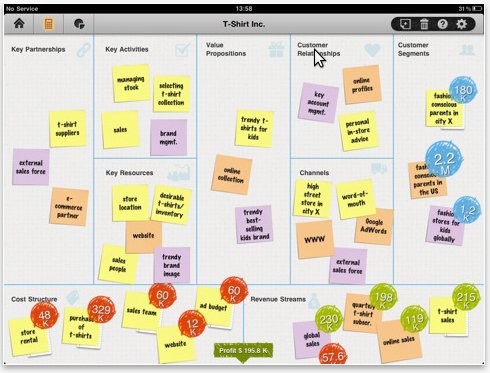
Another example, using a fixed layout, is the business model canvas based on The Business Model Ontology – A Proposition In A Design Science Approach. Available for ipad as well. Nice first steps.Unfortunately no support for realtime collaboration, yet.
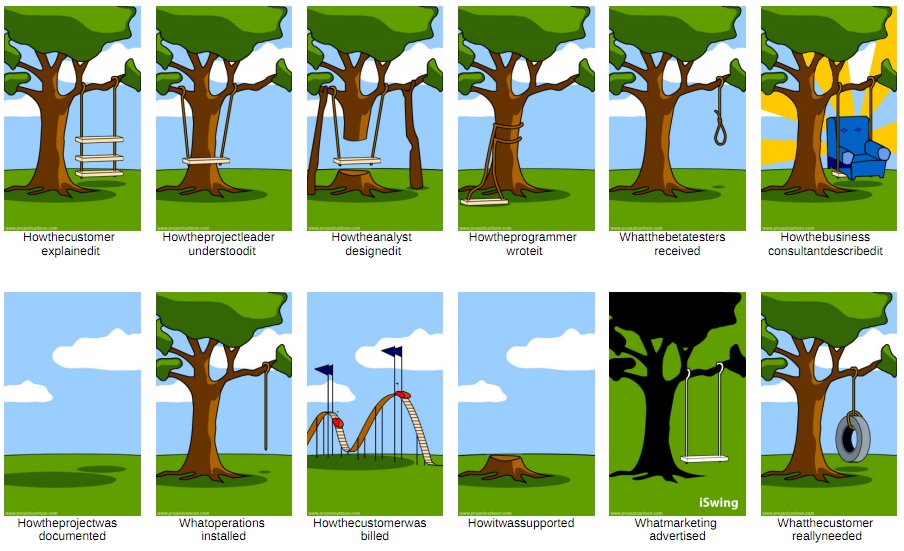
A well known visual narrative example (although there is not really a beginning, plot or ending) is this (mis)management story from projectcartoon:
What is really interesting, is the option to create your own version of the story.
So, now we have seen some visual examples to be used in complicated or complex situation and support decision making. Are these really useful in group interaction?
After watching this episode of Goudzoekers (‘golddiggers’), I learned about Bent Flyvbjerg, a researcher in cost overruns and benefit shortfalls at Oxford University, who offers two reasons for major estimates (dutch: ‘kostenoverschrijding’) in construction projects: (1) human optimism & (2) deliberate misinterpretation/misrepresentation (aka lying).
Knowing that during negotiations in complex situations neither group will be sincere about the intention, because of the unspoken interests of each group or of an individual within that group, it is still questionable that visualizations will help and reduce the ‘leak of energy‘. Both in the short and long run, the individual gains and need for control make people play it pretty close to the chest.
It seems that we talk too much, or at least a lot and most of the times not anout the right stuff: our interests or intentions. In complex situations -where cooperation and competition are in delicate balance- we tend to go around the subject, whether we do this intentionally (because of hidden interests) or not (because of the lack of analytical and communicative capacity). Or perhaps both…
In my proposal I mention ‘whether unexpected, seemingly random and emotionally disturbing developments can improve the cooperation of the whole’. It would be interesting to find out (a) if visualizing ‘hidden interests’ makes a group lower its ‘lack of capacity’ and (b) if visualizing ‘lack of capacity’ enables groups to extract ‘hidden interests’.
Although the examples above are more or less content driven, the balance between complexity and cooperation is also about intention. About a ambition and loyalty. About personal motives close to the chest. About trying to make people explain these motives. About trying to become more effective.
