Some greed is good

No greed no glory, according to the study of Helbing and Roca. Their decision model shows a ‘world’ of greediness, a model promoting cooperation in social dilemma situations, despite very low information requirements while minimizing the influence of imitation, a shadow of the future, reputation effects, signaling, or punishment.

greedgood Source

Some interesting quotes:

We find that moderate greediness favors social cohesion by a coevolution between cooperation and spatial organization, additionally showing that those cooperation-enforcing levels of greediness can be evolutionarily selected.

An open translation from a business developers point of view: shaking new hands is necessary and it benefits your orginization when developing within different cooperations at the same time even without ‘shadow of the future’ and ‘reputation effects’.

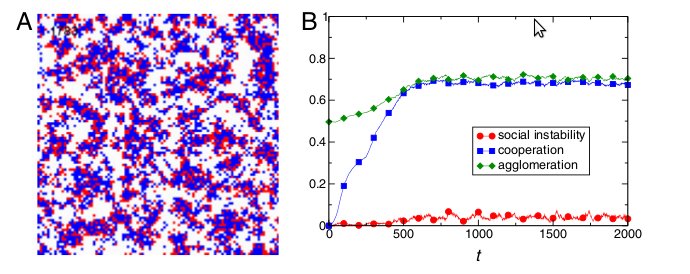
Note that the initial appearance of cooperation is possible only because of the presence of noise in the decision rule.

Again from a business developers point of view: make some noise.

In comparison, a model society of individuals with low levels of
greediness is unable to realize social benefits. It lacks the drive to
develop effective cooperation and agglomeration, because non-
greedy individuals become easily satisfied with whatever payoffs
they obtain and thus, maintain their strategy and position. In
consequence, neither cooperation nor agglomeration emerges in
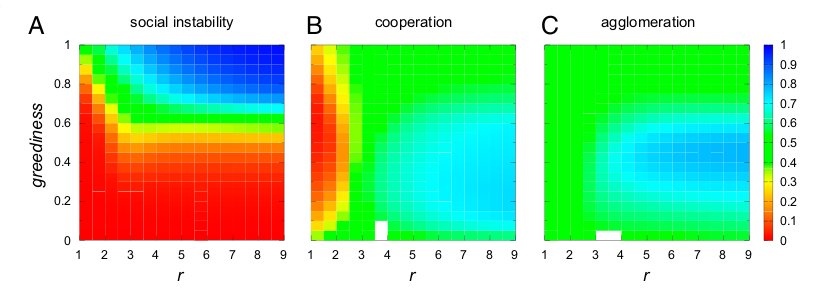
such a society. On the contrary, moderate greediness causes
individuals’ dissatisfaction, making them explore other strategies
and/or positions and experience the benefits of being cooperative
in a cooperative neighborhood. As long as those benefits are
sufficient to satisfy individuals’ aspirations, cooperation and ag-
glomeration coevolve and create a stable population with a high
level of cohesion.

Suppose you are a sponsor, business developer or an administrative employee of an NGO, how should you best define greediness, in a positive way for each role? Perhaps in terms of number of reached refugees, growing turnover, number of projects.

Another interesting insight … is that challenging PublicGoodsGames with very low synergy factors … create a stable society, but one that is locked in noncooperative behavior. Defection is, in this case, the only behavior that is compatible with the aspirations of individuals, regardless of their level of greediness.

Ignorance is bliss.

greedgood2

Our results strongly suggest that learning rules, particularly self-referential factors in decision making, can be a key component in the explanation of the emergence and stability of cooperation and agglomeration in human societies.

Individual awareness of spacial (green beard) or temporal (reputation) ‘hotspots’ however seem to make our lives more complex. 

So knowing this, what would this mean for the ‘battle of universities’ in the Netherlands? The 3 Universities of Technology have been setting up a collaborative program (examples). Recently the Delft University of Technology (DUT) is also aligning with both the Leiden University and the Erasmus University Rotterdam.
It seems in this case there’s no thresshold to the minimal level of ‘greediness’: the need for lowering costs, balancing out curricula and raising funds. Most recent driver is the necessity of being better visible to the growing market, for instance foreign students (using the Shanghai ranking). This is the hand of ‘the shadow of the future’ (Axelrod 1984): ‘we need to cooperate or else…’.
It would be practical for both strategies (3TU & Delft+Leiden+Rotterdam) when Delft would start sharing it’s tactics because of the conflicting interests in both strategies. Assuming these strategies are not conflicting in near future outcome (at least one established cooperation to survive), at the least they are conflicting because of an indisputable, short term energy drain.
Then again, why give all (in this case both) your cards away?

The study of Helbing and Roca assumes lot’s of possible trade-opportunities, whereas the example of the DUT shows no more than 2 main roadmaps, each summed up by 3 partners. One strategy is based on geographical closeness, the other on similarity in domain.
When not only regarding decision makers, but also lobbyists, employees, media and students, we do have a big number of trade opportunities. This is an analogy where trade opportunites are merely the different perspectives and ‘greedy’ outcomes of individuals and smaller groups.
Here we have a relatively large synergy factor (r) and recentlty (juli and august 2011) a high social instability. Perhaps not from Universities points of view, but indeed from individual perspectives.

Why is my mind wandering off, thinking about Monty Pythons ‘You are all individuals!… …Yes, we are all individuals’?

Facebooktwitterlinkedinmail

Embracing Vulnerability

Inspired after watching the TED presentation by Brene Brown, …


… I have to add a comment to a previous post ‘handling intentions‘:

When people are in meetings, there’s a number of activities they seem to prefer:

  1. … Hiding some intentions, making personal notes or for reporting to the ‘organisational backbone’;
  2. … Sharing some intentions…

Assuming people are (un)intentionally hiding part of their notes, what exactly drives them? How usefull is this behavior? Can we express this shielding behavior in terms of vulnerability? Would this perspective of vulnerability explain the behavior on personal level, what does that mean for group behavior?

Exactly how can visualization make us embrace vulnerability, (re)opening and supporting discourse?

Let’s go back and quote Brown about blame in political context:

…You know how blame is described in the research?
…A way to discharge pain and discomfort.

There is a risk that visualization could reinforce unwanted behavior as well. For instance by reinforcing blame. In order to know how to prevent this, we must learn more about types of behavior: fixed action pattern, habituation & operant conditioning.

types_of_behavior watch source movieclip

These types can help us create a steering wheel when dealing with vulnerability.

Facebooktwitterlinkedinmail

Handling intentions

The creative applications network features an inspiring article about visualizing complex information: the psychoeconomic war room table. Why is this relevant to this research? Let us go along, setting aside the kitchen table, a crisis location and the NASA command center, and let us take a closer look at some of the images of war rooms (I’ve boldly copied and insered below) which helps me make a statement about handling intentions.

PWRT-635x640

A war room table inserted the lower right, resembles todays “precede-and-decide” meeting conditions. A large table, seated participants and -if lucky- a big screen or whiteboard. The lower left insert resembles a battle emulator, with simular functionalities like the old school simulator below.

Screen-shot-2011-05-08-at-11.21.27-AM-640x282

Biggest differences to me? The number of people involved, the type of intentions (tactical vs strategic, field vs policy), the ways of neighbour interaction, feedback, simple rules (i.e. traces/ tracks). I wonder which setting will be better in supporting constructive conflict as opposed to destructive conflict.
Regarding these types of conflict, the Dutch documentary ‘sta me bij’, shows a 60 minute example about cooperation (and mutual trust) as a driver versus ego (and personal responsibility) as a driver.

Let’s also take a look at the next image, a screenshot of a computer game called Civilization.

civ5_city_screen-640x511

Why is this relevant? Because it helps us recognise some key-characteristics valuable to ‘visualizing the understanding of decision making’:

  • The game seems to remove Ego’s out of the equation, using metaphores instead of persones to compete with. 
  • The game seems to be both disarming and motivational at the same time. 
  • It seems to be able to force issues at hand. 
  • The game is a multiplayer game, offering shared perspective besides a / parallel to a personal view.

Such characteristics are helpful if we want to perform better in an envisioned world with an interdisciplinary approach, an ‘interstakeholder’ approach, a federal approach, a transgressing approach, a heritable approach when solving complex matters.

When people are in meetings, there’s a number of activities they seem to prefer:

  1. … Hiding some intentions, making personal notes or for reporting to the ‘organisational backbone’; 
  2. … Sharing some intentions, by dialogue or storytelling or using flipovers or other media; 
  3. … Overthinking or evolving some intentions, by scribbling and intimate drawings; and 
  4. … Saving, re-opening, re-reading and re-writing some intentions…

Feel free to try and recognize these activities next time you’re in a meeting.

A final thought. When comparing cooperation and competition, it occured to me that (1) ants have no ego’s, (2) ants are tollerant to their own, (3) ants use temporal cooperation, especially when competing. Check out this small ant defending his bigger friend and their food (source).

Ant-carry-21

Who needs a war room? As Steven Berlin Johnson suggests in his book Emergence: Emergence can occur when there is neighbour interaction, pattern recognition, feedback, and indirect control. Don’t have a copy? Not to worry, the book is explained at this post.
So, inspired by the writers of a new book called ‘Vision in Design’

Accept complexity, go straight through it – no work around – and reduce into helpful interactions. Take your responsibility as a designer.

Facebooktwitterlinkedinmail

Influence and social cannibalism

In the Labyrint (vpro, dutch) episode about ‘power of the masses’, some interesting issues surface.

The episode refers to scientific experiments about the power of a both big and small groups to influence and steer individual opinions and responses; describing ‘I vote exactly like the othershink, even when I know I was right‘ and ‘I vote exactly Iike I think others would or think I should’. Examples are given of people influencing people and robots influencing cockroaches. A high degree of acceptance through social or physical recognition seems an important factor necessary for this influence to occur.
How can this knowledge be used to bring groups together in generating and sharing solutions in complex situations? With (exploiting) or without (repressing) ‘fake, dishonest personal rationalisation of personal, individual behavior’.

We – humans – are suggested to feel safe within groups borders. Because of are social group survival skills. Let’s extrapolate on this: what if today, we have become our own predators? It is not hard to imagine a species at the top of one of the foodchains on this earth, we more or less only have boosted ‘in-species’ competition. Coexisting with group safety there is individual (and group) competition. Perhaps we’ve learned to cannibalise socially. I am curious how Frans vd Waal would respond to this statement.

After watching the video below (vpro, belgian) to the end, we can ask ourselves whether -the concept of- group safety is a driver for our behavior or simply an emerging result due to our evolved individual ability to ‘physically read’ social signs.

I’ll be focussing on smaller groups. A light introduction to mass behavior – from a marketing perspective – is available at ‘the herd’ by Mark Eals.

Facebooktwitterlinkedinmail

Visualization and how we tick (rough setup)

Competition versus cooperation

How can visualization help us grasp the nature of our complex relationships?

Visualization, what makes it work and does it relate to how we tick

Graphics have an advantage over language in expressiveness (Stenning & Oberlander, 1995); graphics use elements and relations in graphic space to convey elements and relations in real or metaphoric space. ” [the cambridge handbook of thinking and reasoning , 2004, Chapter 10, Visuospacial reasoning, by Barbara Tversky ]

Compared to text, static -non interactive- visualizations of a complicated (and not complex) business strategy prove that when ‘information is communicated through conceptual visualization, the user has a more positive emotional response, which in turn makes the cognitive response more positive’.

Complex systems – Whether drawing a map in the sand or designing an pipeline system of an airplane, visualization helps us explain and understand. Interactive visualization has a positive effect on knowledge sharing activities, regarding to productivity, quality of outcome and knowledge gains [The benefits of synchonous collaborative information visualization: evidence from an experimental evaluation, 2009, S. Bresciani, M.J. Eppler] It is unclear if the same goes for visualizing the understanding of complex systems, like understanding a juridical system, deciding about distribution of aid, developing water management, or marketing converging Universities of Technology.

Constructive (/ productive / functional) conflict – There are examples of successful implementation of visual tools in decision making. Dimicco states …. {oude stuk kopieren}.

Mengis and Eppler [Seeing versus arguing, the moderating role of collaborative visualization in team knowledge integration, 2006, J. Mengis, M.J. Eppler] state that ‘conversers who interact without an interactive visual support … do not manage to deal constructively with conflict’. They quote Bregman and Haythornthwaite [A. Breman C. Haythornthwaite, Radicals of presentation in persistent conversation, 2001] that concersations are ephemeral, concluding that ‘the major reasons and motivations behind the decisions taken stay often poorly documented’. Mengis and Eppler conclude that thier visualization tool improves decision making, with (a) an increased weight of the constructs ‘Big picture’ and ‘Common ground’ and (b) a decreased weight of the constructs ‘Balanced participation’, ‘Task conflict’ and ‘Relationship conflict’:

… we can say that without an interactive visual support {they} struggle more to integrate their knowledge: they lack common ground and the big picture in the conversation and therefore give more importance to equal participation and conflict.

They also state that interactive, realtime visualization makes conversers taking content criticism less personally.

This research focusses on expert-decision making interaction. One of the stated reasons for success is that visualization helps to depersonalize conflict and emphasizes common ground and the big picture. According to Mengler et al. visualization supports knowledge integration through a set of three conflict characteristics: (1) a moderate level of content {/ cognitive} conflict, (2) a low level of relationship {/ affective} conflict and (3) a low correlation between (1) and (2).

Kurtz and Snowden [Bramble bushes in a thicket, narrative and the intangibles of learning networks, ????, C.F. Kurtz, D.J. Snowden] mention a third type of conflict described in literature besides cognitive and affective conflict, and that is process conflict. According to Kurtz et al. several authors found only cognitive conflict to be helpful for group performance. They also state that real life emphasis on only one of these types is dangerous.

Shared behavioral cooperative norms can help balance out (emphasis on) cognitive conflict, expressed in terms of openness and mutuality. Openness and mutuality emerge when groups maximize cognitive conflict and minimize affective conflict [The effects of conflict on strategic decision making effectiveness and organizational performance, 1997, A.C. Amason and D.M. Shweiger].

Further Alper et al.’s ‘conflict efficacy’ is found to be useful – quoted by Kurtz and Snowden: ‘it says that conflict should not be measured by its nature or origin, but by its contribution to the perception among group members that conflicts can and are dealt with productively’. In other words: being confident helps a group overcoming conflict.

Finally interorganizational networks are explained as being a source of both new knowledge and of productive conflict ‘that improves the organisation’s ability to reinvent itself from within’.

Hidden motivations – Conversations are mostly ephemeral [{lezen!} Radicals of presentation in persistent conversation, 2001, A. Bregman, C. Haythornthwaite], leading to poorly documented reasons and motivations behind the decisions.

It would be interesting to determine the role of visualization in overcoming this ephemeral character, without giving in to time or capacity restrictions, when dealing with an ‘Organizational Backbone’, for instance during a situation of civil service resistance.

Risks of visualizations

{piece eppler}

{blogpost pvp analysis/communication} Exploring data sets and communicating your findings are two different activities. Typically, the same visualization approach does not suit both, because (a) exploratory visualizations are too complex to communicate and (b) communicative visualizations cannot be created until data is explored. There seems to be a gap between ‘analysis before communication’ and ‘communication before analysis’.

{slide pvp dataporn}

Supporting the narrative

{bramble bushes, kurtz & snowden}

Intention and interest and influence

{still reading about: undermine unhelpful believes and attitudes: mental imagery and implicit memory}

Facebooktwitterlinkedinmail

Visual deliberation: Playing it close to the chest

There are several tools/ methods/ techniques delivering visual support for decision making. A nice overview is this periodic table of visualization.

periodic_table

There are visuals that unravel arguments by using diagrams, and those that combine arguments by embedding them in a story. In my opinion, both types can help both explain and fend of arguments.
Let’s examine a some diagram types, as a warming up before discussing the potentional and impact of working with visualizations in complex situations.

The method of argument mapping (i.e. De argumenten kaart) delivers a visual overview using lists framed within the limits of an A3-paper.

argumentenkaart

Relations between arguments stay unclear. The tooling of debategraph tries to make these relations comprehensible by adding some interactivity, for instance by using different views of the same information.

debategraph

So when are we talking about argument infographics and when about argument maps? This is what Tim van Gelder mentions at his blog.

Another example, using a fixed layout, is the business model canvas based on The Business Model Ontology – A Proposition In A Design Science Approach. Available for ipad as well. Nice first steps.Unfortunately no support for realtime collaboration, yet.

bmc_ipad

A well known visual narrative example (although there is not really a beginning, plot or ending) is this (mis)management story from projectcartoon:

projects

What is really interesting, is the option to create your own version of the story.

So, now we have seen some visual examples to be used in complicated or complex situation and support decision making. Are these really useful in group interaction?
After watching this episode of Goudzoekers (‘golddiggers’), I learned about Bent Flyvbjerg, a researcher in cost overruns and benefit shortfalls at Oxford University, who offers two reasons for major estimates (dutch: ‘kostenoverschrijding’) in construction projects: (1) human optimism & (2) deliberate misinterpretation/misrepresentation (aka lying).

Knowing that during negotiations in complex situations neither group will be sincere about the intention, because of the unspoken interests of each group or of an individual within that group, it is still questionable that visualizations will help and reduce the ‘leak of energy‘. Both in the short and long run, the individual gains and need for control make people play it pretty close to the chest.

It seems that we talk too much, or at least a lot and most of the times not anout the right stuff: our interests or intentions. In complex situations -where cooperation and competition are in delicate balance- we tend to go around the subject, whether we do this intentionally (because of hidden interests) or not (because of the lack of analytical and communicative capacity). Or perhaps both…

In my proposal I mention ‘whether unexpected, seemingly random and emotionally disturbing developments can improve the cooperation of the whole’. It would be interesting to find out (a) if visualizing ‘hidden interests’ makes a group lower its ‘lack of capacity’ and (b) if visualizing ‘lack of capacity’ enables groups to extract ‘hidden interests’.
Although the examples above are more or less content driven, the balance between complexity and cooperation is also about intention. About a ambition and loyalty. About personal motives close to the chest. About trying to make people explain these motives. About trying to become more effective.

Facebooktwitterlinkedinmail

Feynman Diagram

Neither in Sketching at work, nor in A periodic table of visual methods I can find a relation with the Feynman Diagram:

@Xner, if you’re out there, please enlighten me!

Facebooktwitterlinkedinmail

Wubbo Okkels

NRC Weekend, zaterdag 14 mei & zondag 15 mei, 2011. Tekst: Gijsbert van Es.

… ex-astronaut Wubbo … hoogleraar in Delft: “voor mij is de oogsttijd aangebroken”.

… “binnen een half jaar had ik een consortium gevormd… we presenteerden een plan… wat was de reactie? Het is een integraal plan en dus: te ingewikkeld. Niet eens te duur, nee: te complex.
Want veiligheid: daarover gaat Rijkswaterstaat. Energie: dat is van Economische Zaken. Duurzame energie: weer een ander clubje amtenaren. Natuur, recreatie: idem.
In Nederland heerst bestuurlijk onvermogen om grootse projecten te managen.”

Spot on, Wubbo! Except for the fact that (1) most civil servants and most decision makers don’t like having a target on their heads and (2) if government can’t manage big complex projects, perhaps the question is ‘What exactly withholds such a consortium to find a public (or private) project owner?’ … of course, if more organisations feeel related to an issue, less organisations feel fully responsible.
Could it be that public decision makers have different agenda’s which they balance as a zero-sum game for the group and a win-or-loose game for individual, personal careers and more intimate group relations?

…”Dit kan ook weer zo’n geweldig export product zijn. Maar net als bij de Superbus kost het me een hoop energie om het bedrijfsleven hiervoor te interesseren.
Wij Nederlanders zijn een volk van koopmannen. Wij handelen het liefst in bestaand spul – lekker veilig. Onze handelsgeest zit onze innovatiekracht in de weg”

… “Hier in Delft heerst de sfeer die W.F. Hermans beschrijft in ‘Onder professoren’. Jaloezie, trucjes, achterklap.
Het probleem zit niet zozeer aan de top. Met het collega van bestuur heb ik een uitstekende relatie.Met de collega-hoogleraren loopt het meestal ook wel.

…De stagnatie zit op het niveau daar onder en bij de ondersteunende diensten. … De bureaucratie moet op het geld, contracten en andere regeltjes letten en is dus per definitie gericht op beheren en beheersen.
In de cultuur van een universiteit is dat volledig doorgeslagen: ondersteunende diensten zijn aandacht vragende en energie vretende diensten. Ik zal er nooit aan wennen.”

Wow.

It seems that we can add an additional dimension perpendicular to cooperation and competition: direct vs long term impact.

I mostly agree with Wubbo. I do believe we need to develop something to better guide decision makers in complex situations.
What’s in the breathing gap in between comfort zone and no-go area’s? Interactive visual feedback.

Facebooktwitterlinkedinmail