Testing joooid plugin. Nice picture of my writings getting corrections 😉
Continue reading “Upload from joomla app on android phone”
visualizing the understanding of relationships
research blog supporting instantdebriefing.com
Testing joooid plugin. Nice picture of my writings getting corrections 😉
Continue reading “Upload from joomla app on android phone”
I am intrigued by the clumsy graphical translation in my paper today (NRC weekend, september 24th and 25th 2011, volume 303 Algemeen Handelsblad), about the dutch annual policy reflections in The Hague:
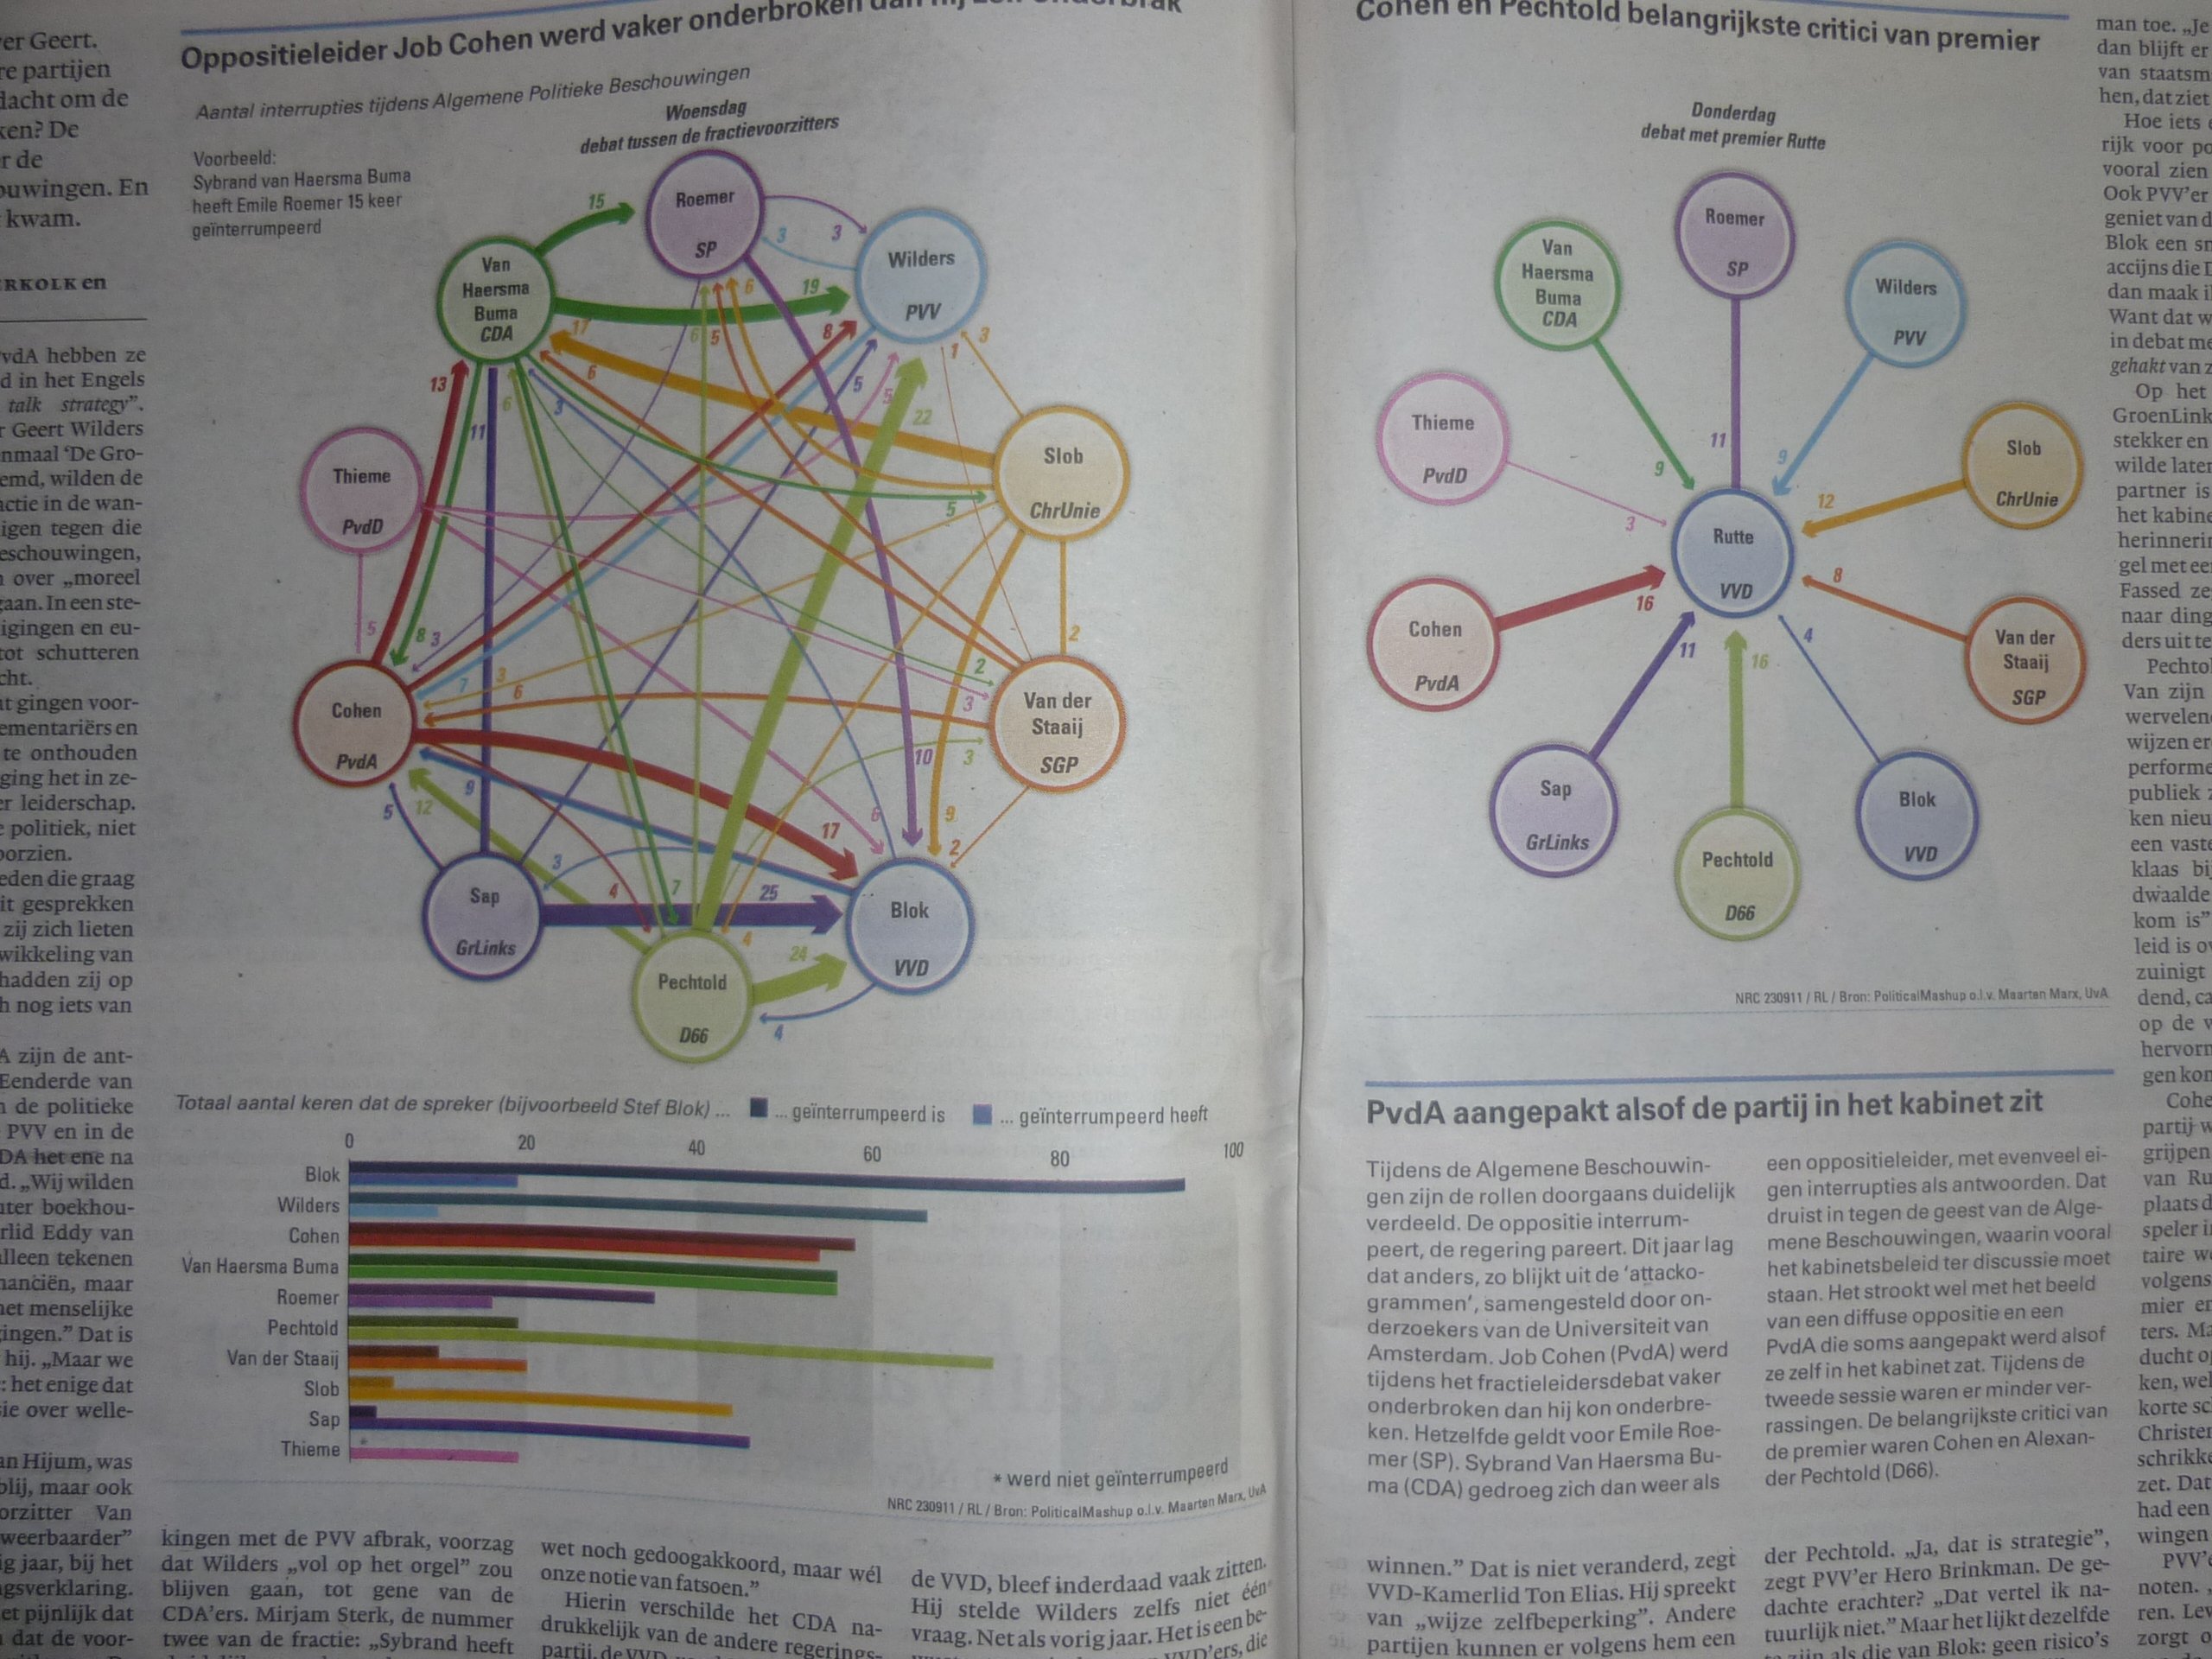
1) upper left: what a mess. Why not use a rosette system like this one?
2) upper right: why let these colors compete for attention with the small bandwidth of widths of the arrows?
3) lower left: why not write: ‘People who have opposite standpoints interrupt each other more often’?
Luckily there is a source: Political mashup: research about wordclouds and xml by the Amsterdam University. The paper and Political mashup collaborate and have a shared platform with conceptual graphics.
Btw, this original image shows better proportions of arrow widths.
Diging a little bit deeper we find an amusing and interesting student contribution to an impressive Open Data Challenge (2011):
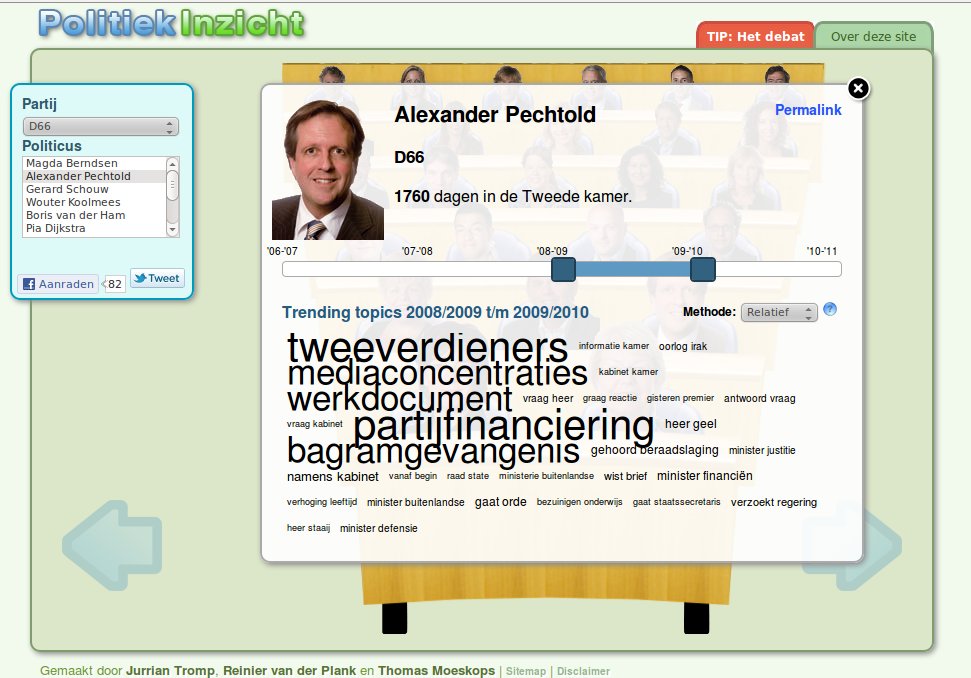
From there, through the red tab, we find the orignal funny and mature looking source of the clumsy translation by my newspaper:
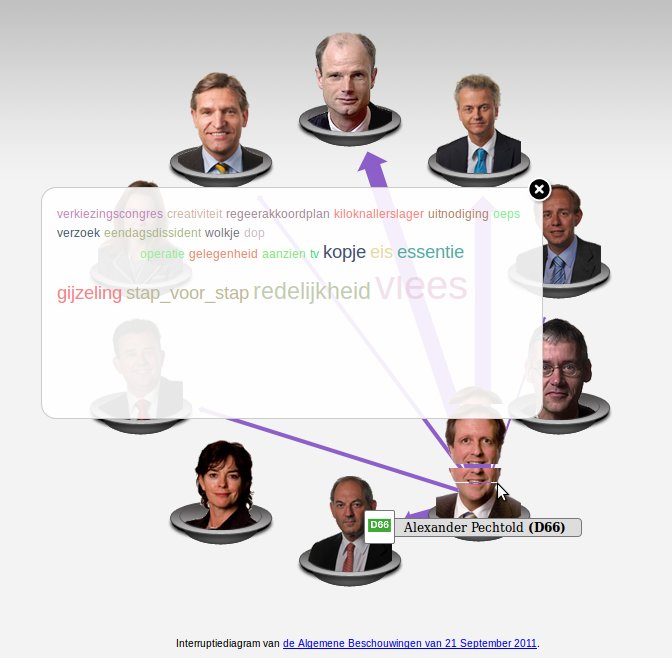
… I was a bit puzzling finding out how the color coding works, though. Very well done, Jurrian Tromp, Reinier van der Plank en Thomas Moeskops! They appear to have removed quite some distracting elements from one of their inspirations: http://www.congressspeaks.com. I hope Political Mashups and NRC keep learning and perhaps sponsoring students or providing internships! Perhaps this will one day lead to visual support of understanding political profiles and voting.
An inspiring animation (Balance, 1989, by Wolfgang & Cristoph Lauenstein) about group balance:
… found it as part of a ‘Tegenlicht’ episode (VPRO, September 19th 2011): “Shortly after the start of the 2008 financial crisis sociologist Manuel Castells gathers a small group of international intellectuals around on a deeper refelection regarding the crisis”.
‘
Nice visualizations of (competition between) methods and goals when working together. An example of the original post by Fergus Bisset:
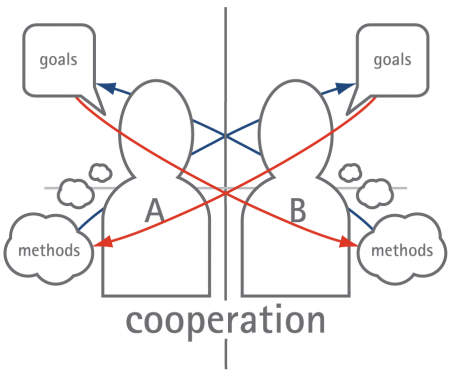
Cooperation (cc Fergus Bisset)
David Burkus explains Survivorship Bias here:
Any time you only examine the successes, you will skew the results.
This is exactly why I like the idea of using a nogari Window desides a johari Window (previous post).
@ innovationgames.com a simple tool for creating visually oriented games, which can be easily shared online. A screenshot of a quick test, using the free version:
You can easily invite your players, by hand and by arranging a ‘party’, so people can subscribe and enter the lobby at a given time.
…if you don’t want to buy / pay for additional services, try building your own with Opa
According to Kanai, Feilden, Firth and Rees (2011)…
… Political orientations are correlated with brain structure in young adults. … Our findings extend previous observations that – high level concepts of – political attitudes reflect differences in self-regulatory conflict monitoring and recognition of emotional faces by showing that such attitudes are reflected in human brain structure.
So, to what extension are we hard wired and sized up with our Anterior Cingulate and Right Amygdyla?
As described in ‘Visualization and how we tick’:
Mengis and Eppler [Seeing versus arguing, the moderating role of collaborative visualization in team knowledge integration, 2006, J. Mengis, M.J. Eppler] state that ‘conversers who interact without an interactive visual support … do not manage to deal constructively with conflict’. They quote Bregman and Haythornthwaite [A. Breman C. Haythornthwaite, Radicals of presentation in persistent conversation, 2001] that concersations are ephemeral, concluding that ‘the major reasons and motivations behind the decisions taken stay often poorly documented’. Mengis and Eppler conclude that thier visualization tool improves decision making, with (a) an increased weight of the constructs ‘Big picture’ and ‘Common ground’ and (b) a decreased weight of the constructs ‘Balanced participation’, ‘Task conflict’ and ‘Relationship conflict’:
… we can say that without an interactive visual support {they} struggle more to integrate their knowledge: they lack common ground and the big picture in the conversation and therefore give more importance to equal participation and conflict.
They also state that interactive, realtime visualization makes conversers taking content criticism less personally.
There are two differences. First, the research of Mengis and Eppler focusses on visualizing content, and not visualizing behavior (like DiMicco and myself). My hypothesis concerns the use of visualization to make (individuals in) groups more assertive, minimizing misdirected energy and maximizing the effectiveness. With a focus on cognitive reframing and multiple attitudes.
The linking pin is a set of recommendations by Amason and Schweiger (1997), as quoted by Kurtz and Snowden in a context of openness and mutuality:
Kurtz and Snowden: … {the} observation that groups which maximise cognitive conflict and minimise affective conflict create an atmosphere of openness and mutuality. Each of these qualities is well known to be supported by narrative exchange, and as such can be augmented using narrative techniques.
Amason and Schweiger: … to the extent that cognitive conflict can be encouraged while affective conflict is restrained, top management teams may be able to “gain the benefits of conflict without the costs” (Eisenhardt & Zbaracki, 1992: 34)
The question is how we can use visualization to overcome our nature: multiple attidutes and rationalization as part of cognitive bias. Here’s an explanation by Amason and Sapienzea (2011):
Cognitive conflict is task-oriented disagreement arising from differences in perspective.
Affective conflict is individual-oriented disagreement arising from personal disaffection.
Bresciani, Tan and Eppler (2011) add the following, in a way suggesting more bling without graphical disturbance:
We propose a model … where visualization has a positive effect on the emotional response of the user that in turn has a positive impact on the cognitive response.
Instead of the more or less temptational approach of Brescani, Tan and Eppler, I suggest to use visualization with an approach of Operant conditioning.
Second, instead of using one context (a company that needs decisions on her project portfolio), I propose a multiple context (many companies that need to find out potential matches towards a not yet shared portfolio of activities). In this case the question ‘why and what’s in it for me and my organizational backbone’ is very much present. It is a more behavioral approach focussing on cognitive reframing and multiple attitudes. And less about transfer of the knowledge.
I am impressed with the unique work of Eppler et al. I’m xpecting to see and learn more, driven by questions as: why exactly do Epplers visualizions do what they need to do? There is more to study regarding regarding visual sallency and best practices.
Regarding my previous research posts, I suggest 3 main solution areas lie ahead: (a) cognitive reframing, (b) multiple attitudes and (c) visual sallience (aka sallency). Let’s make sure we don’t have a ‘Confirmation bias on our hands’.
Our context remains decision making in complex situations, with a focus on visualizing the understanding of relationships, making decision making more effective. I have been looking for disturbance, but it seems we have enough grounds for and types of disturbance (100+ cognitive biases). The trick will be to choose or design an appropriate type of visual feedback -probably related to visual salience- so we can tune the aspects of cognitive reframing and multiple attitudes.
Some preliminary definitions, yet without solid scientific references:
Cognitive restructuring {reframing} in cognitive therapy is the process of learning to refute cognitive distortions, or fundamental “faulty thinking,” with the goal of replacing one’s irrational, counter-factual beliefs with more accurate and beneficial ones.
An Attitude is a mental and neural state of readiness, organized through experience, exerting a directive or dynamic influence upon the individual’s response to all objects and situations with which it is related (Allport, 1935)
The salience (also called saliency) of an item – be it an object, a person, a pixel, etc – is the state or quality by which it stands out relative to its neighbours. Saliency detection is considered to be a key attentional mechanism that facilitates learning and survival by enabling organisms to focus their limited perceptual and cognitive resources on the most pertinent subset of the available sensory data. {this article (Computational modelling of visual attention, 2001, Itti and Koch) and its sources will help defining visual salience}
Let us not forget our context of differentiation over place, time and decision making unit. Nor our emergent understanding about shifting loyalties and their competitiveness.