Complexity, Energy & time

A news item of the Santa Fe Institute led me to this talk of Geoffry West:

At 15min50, there’s a slide telling us that:

… organisms have evolved by natural selection,
so as to:
a) minimize energy dissipated in the networks
and/or
b) maximize the scaling area of interface with their recource environment

From the domain of this research we could hypothesize:

… organizations have evolved by natural selection,
so as to:
a) minimize energy dissipated in the networks
and/or
b) maximize the scaling area of interface with their recource environment

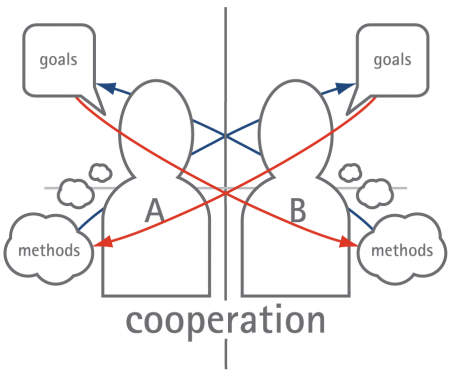
What does this tell us about the interaction between cells, organisms, people and organizations? What happens at the interface of a mobile organism in between organizations? This is an area where people interact, balancing between the a)’s and b)’s of different organizations.

At about 22min West explains:

‘If I take time …and if I correct {some stuff} …everybody lives, evolves, dies at the same rate …if you do the appropriate corrections’.

This helps us realize, and not define, the timing difficulties in complex decision making, lifted over the walls of standing organizations.

In a similar SFI video D’Souza (at 28min) explains that – when using a little bit of communication – regarding to non zero sum games:

Coordination brings USER optimal in line with SYSTEM optimal

Facebooktwitterlinkedinmail

Different types of decision trees

After reading an article in my newspaper about decision making and the role of regulators (dutch, source NRC) plus this older article (dutch, 1999, source nrc), I found two different types of decision trees.

First, there is one like Prof. Dr. Sweder van Wijnbergen developed for the dutch ministry of finance. This tree is more a decision making flow chart (source aef, page 11), a tree that leads to action based on a framework of experience:

sweder

Second, there is the type that helps compare possible outcomes (source wiki), that leads to action based on ball park figures and best estimates:

Manual_decision_tree

Both decision trees however offer the support of shared understanding. This overview is not only helpfull to work towards the decision itself, but mainly helps exploring and explaining the process of decision making. They support a dialogue better and faster that any text paragraph would do and offer support in conflict resolution.

There’s clearly a functional overlap between decision trees and argument maps (see periodic table, information visualization). All types have both a sense making function and a memory / retention function.
This slidedeck
explains more about how elements of a tree/map support organizing information: segmentation (a series of propositions), coding & hierarchy.

Facebooktwitterlinkedinmail

Political interruptions

I am intrigued by the clumsy graphical translation in my paper today (NRC weekend, september 24th and 25th 2011, volume 303 Algemeen Handelsblad), about the dutch annual policy reflections in The Hague:

nrc230911

1) upper left: what a mess. Why not use a rosette system like this one?
2) upper right: why let these colors compete for attention with the small bandwidth of widths of the arrows?
3) lower left: why not write: ‘People who have opposite standpoints interrupt each other more often’?

Luckily there is a source: Political mashup: research about wordclouds and xml by the Amsterdam University. The paper and Political mashup collaborate and have a shared platform with conceptual graphics.
Btw, this original image shows better proportions of arrow widths.

Diging a little bit deeper we find an amusing and interesting student contribution to an impressive Open Data Challenge (2011):

politiek_inzicht

From there, through the red tab, we find the orignal funny and mature looking source of the clumsy translation by my newspaper:

debat

… I was a bit puzzling finding out how the color coding works, though. Very well done, Jurrian Tromp, Reinier van der Plank en Thomas Moeskops! They appear to have removed quite some distracting elements from one of their inspirations: http://www.congressspeaks.com. I hope Political Mashups and NRC keep learning and perhaps sponsoring students or providing internships! Perhaps this will one day lead to visual support of understanding political profiles and voting.

Facebooktwitterlinkedinmail

Balance

An inspiring animation (Balance, 1989, by Wolfgang & Cristoph Lauenstein) about group balance:

… found it as part of a ‘Tegenlicht’ episode (VPRO, September 19th 2011): “Shortly after the start of the 2008 financial crisis sociologist Manuel Castells gathers a small group of international intellectuals around on a deeper refelection regarding the crisis”.

Facebooktwitterlinkedinmail

Visual collaboration game

@ innovationgames.com a simple tool for creating visually oriented games, which can be easily shared online. A screenshot of a quick test, using the free version:

visual_innovation_games

You can easily invite your players, by hand and by arranging a ‘party’, so people can subscribe and enter the lobby at a given time.

…if you don’t want to buy / pay for additional services, try building your own with Opa

Facebooktwitterlinkedinmail