Very similar to one of my early proposals of group mapping and visualization …
… I’ve found an visualization approach, called the Johari window. It uses a set of adjectives that all members of a group use to describe / score each other. I’ve used an online johari tool, filled in testdata about myself (pljvp) and let 2 ‘others’ (pljvp1 & pljvp2) score my data as well. Here’s the result
Arena(known to self and others)
searching, sympathetic, trustworthy |
Blind Spot(known only to others)
complex, friendly, giving, happy, patient, relaxed, self-assertive |
Façade(known only to self)
intelligent, self-conscious |
Unknown(known to nobody)
able, accepting, adaptable, bold, brave, calm, caring, cheerful, clever, confident, dependable, dignified, energetic, extroverted, helpful, idealistic, independent, ingenious, introverted, kind, knowledgeable, logical, loving, mature, modest, nervous, observant, organised, powerful, proud, quiet, reflective, religious, responsive, sensible, sentimental, shy, silly, spontaneous, tense, warm, wise, witty |
All Percentages
able (0%) accepting (0%) adaptable (0%) bold (0%) brave (0%) calm (0%) caring (0%) cheerful (0%) clever (0%) complex (50%) confident (0%) dependable (0%) dignified (0%) energetic (0%) extroverted (0%) friendly (50%) giving (50%) happy (50%) helpful (0%) idealistic (0%) independent (0%) ingenious (0%) intelligent (0%) introverted (0%) kind (0%) knowledgeable (0%) logical (0%) loving (0%) mature (0%) modest (0%) nervous (0%) observant (0%) organised (0%) patient (50%) powerful (0%) proud (0%) quiet (0%) reflective (0%) relaxed (50%) religious (0%) responsive (0%) searching (50%) self-assertive (50%) self-conscious (0%) sensible (0%) sentimental (0%) shy (0%) silly (0%) spontaneous (0%) sympathetic (50%) tense (0%) trustworthy (50%) warm (0%) wise (0%) witty (0%)
You can make your own Johari Window, or view pljvp’s full data.
The johari window maps the attributes and shows how people think of me and how I think about others. As others judged me, I could judge others as well.
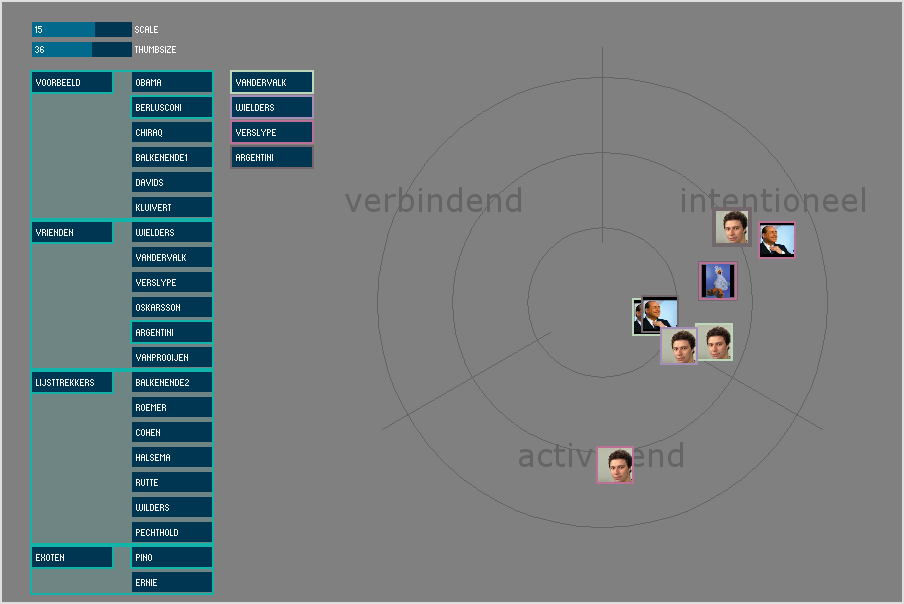
The first difference to my own approach is that I used a small set of words (from a 3Dimensional model) and let people map each others pictures on it, instead of using a big set of words to cluster these into a 2D grid. So Johari creates cluster attitudes per person whereas my own approach creates a stacked overview of a users, for a smaller set of attributes.
Second, Johari used datacollection through a selection of key words, whereas I used a slide on which pictures could be arranged. We can suggest that both tools could use interview techniques, combined with word counting or labeling methods as well.
Third, as this wiki article suggests, the Johari window indeed ‘seems closely related’ to Myers-Briggs Type Indicator, both enabling people to better understand themselves and their position, in order to make better decisions. However I am looking for a visualization that can create an impact on group behavior, focussing on expressing and debating (shifts in) perceived attributes like e.g. loyalty to a group level. A visualization that helps groups come straight to the point and does not necessarily need support from professional or time consuming interview techniques. The dialogue should come after the visualization, focussed on the problem and enabling people. Not before.
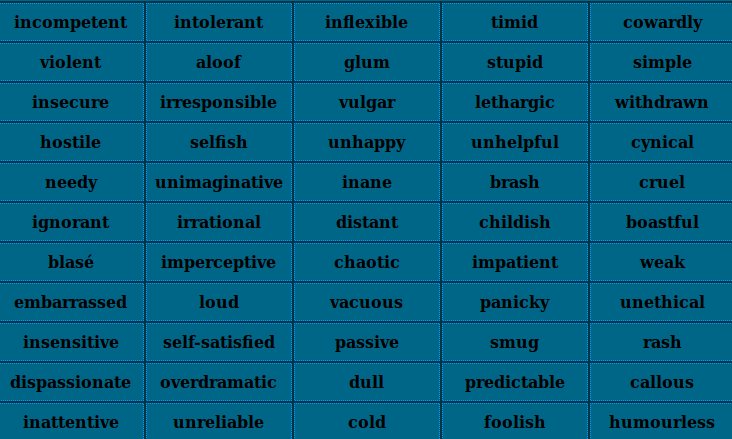
Of course, the Johari window can also be used offline, i.e. like a classic board game with textcards. Althoigh I must say I’m really charmed by the simplicity of Kevan Davis’ online example and impressed with both his website and his twitter picture! Nice add on: a nogari version with failing orriented, negative attributions / keywords: