Prof. Martin Eppler on Visualizing Knowledge for Management RoCCunisg

Found me a giant for the visualization part… One question that pops up is ‘so what’s handy when dealing with complex situations’, and at the same time taking cooperation with(in) vs competition between groups/individuals into account?

Eppler: “Not only the productivity of teams using visualisations software was significantly higher, but also the quality of their work was higher… {although they do not perceive the difference (source, 5.1 Findings)}. Even more so, on an individual basis, the recall and knowledge gains that we tested were much higher in the visualization supported software groups than in the flip chart groups”.

theoretical_bg

some articles

A guide to usability dimensions (which visualization to use when …)

Facebooktwitterlinkedinmail

Cynefin framework

A nice framework: Cynefin, published in Harvard BReview (by David J. Snowden and Mary E. Bone, 2007).

In complex situations -“where cause and effect are in hindsight” – probing, sensing (sense making) and responding successively lead to emergent practice. Emergent practice is not the same as novel practice (chaotic situations), best practice (complicated situations) or good practice (simple situations).

Assessing and recognizing the type of situation should help choose your next activity, responding from a disorderly situation:
* Sensing -> Categorizing/Analizing… (from simple/complicated situation to best/good practice)
* Probing -> Sensing … (from complex situation to emergent practice)
* Acting -> Sensing … (from chaotic situation to novel practice)

A slightly adapted perspective on the same framework can be watched here, envisioning a consecutive process, a loop of ‘maturity’ through all situations.

A related ‘sensemaking toolkit’ can be found here. Using a visual reference approach to probe stories without an intermediate expert. Useful for probing large amounts of stories and obtaining respondents’ values. About feedback to the respondents themselves I have not found any clue yet…

sensemaking_toolkit

Similar visualization is used in MDSI by Stappers and Pasman as an interactive visual dialogue technique.

MDSIProtoSkates

Facebooktwitterlinkedinmail

Visual thinking and sensemaking

These guys are stuck with each other but are not identical. Briljant case of sensemaking and feedback, although not very complex…

2headed

Facebooktwitterlinkedinmail

Why Published Research Findings Are Often False

This Slashdot article (based on an article in the Newyorker) is asking some interesting questions about scientific publications. The readers comments suggest different types of reciprocity …

Jonah Lehrer has an interesting article in the New Yorker reporting that all sorts of well-established, multiply confirmed findings in science have started to look increasingly uncertain as they cannot be replicated …

… According to John Ioannidis, author of Why Most Published Research Findings Are False, the main problem is that too many researchers engage in what he calls ‘significance chasing,’ …

I recommend reading the comments of the slashdot readers…

Facebooktwitterlinkedinmail

Design Thinking

Tim Brown urges designers to think big in this TED talk:

…nice summary about participatory design / design thinking.

… Instead of thinking in order to build, building in order to think …

Exactly how I consider the value of visualizing the understanding of relationships. Group collaboration needs a two step rocket:

  1. Realtime visualizations of direct relationships (within a collaborative subset of indivuiduals)
  2. Summarized visualizations of indirect relationships (between the organisational ‘backbones’ of those individuals)

…visualize in order to build & think…

Tim Brown urges designers to think big

Facebooktwitterlinkedinmail

Exploring vs communicating

Martin Krzywinski presents an alternative representation of hairball-like network visualizations:

Exploring data sets and communicating your findings are two different activities. Typically, the same visualization approach does not suit both.

  • Exploratory visualizations are too complex to communicate.
  • Communicative Visualizations cannot be created until data is explored.

exploringvscommunicating Screenshot slide 3. See more @ this presentation

To me this pleads for finding a way of realtime data visualization. And for working with small datasets, to keep things simple.

Facebooktwitterlinkedinmail

Torrent animated

Nice animated interactive explanation of how torrents behave. Skip the screenshot; go and explore the source below!

bittorrent_animated

Source You play with it by adding/deleting a peer. You can hack the original processing-programm (object orriented java) as well…

… A pitty that torrent files are quite robust (content and size), instead of ever changing content of dialogues and interaction within a group… where new rules (aka new content) leads to new behavior.

Let’s compare (yes, wild comparison) this torrent model with live group information exchange. Every peer would create his/her own interpretation of the original content and likely try to contaminate or enrich the original content:

[?] Will content ever be synced over all nodes?
[?] What criteria would influence convergence of information (aka a shared perspective)?
[?] Which distribution of content is needed to let enough peers agree: ‘ok, let’s do this’?

All torrents roughly behave alike.
[?] But what if some peers would apply tit-for-tat, other peers would apply direct reciprocity and some of those peers would also have to agree with their organisational backbone (kin selection), before concluding the value of information? Or, in collaboration, don’t people usually mix types of reciprocity.
[?] Can types of reciprocity be seen as one (ore a mixed set of) attribute(s) of a relation?

Facebooktwitterlinkedinmail

Five rules of cooperation

In her book “Complexity a guided tour”, Mitchell refers to ‘Idea models’ (chapter 14, Prospects of Computer modeling). According to Mitchell Idea models are to have 4 roles in science:

  1. Show that a proposed mechanism for a phenomenon is plausible or not
  2. Explore the effects of variantions on a simple model and prime one’s intuitions about a complex phenomenon
  3. Inspire new technologies
  4. Lead to mathematical theories.

[?] What if we could transfer these mathematical theories into practical tools?

[!] Let’s take the set of equations, presented by Nowak (Science 2006) in ‘Five rules for the evoluion of cooperation’ (Nowak). He shows an equation for every type (or at least a fixed set) of reciprocity. This typology is similar to that of Benkler (see earlier post ‘Types of altruism’).

Kin selection

b/c >1/r

r…coefficient of relatedness

Direct reciprocity

b/c >1/w

w…probability of another round

Indirect reciprocity

b / c > 1 / q

q…probability to know reputation

Graph selection

b/c >k

k…number of neighbors

Group selection

b/c > 1 + n/m

n…group size
m…number of group

[!] These equations are a valuable basis exploring relationships and reciprocity, provided they are to  be translated in some kind of questioning tool. This way, there will be a basis for datacollection and exploration:

  1. Translation of equations into words, so a questionairre or interviews (for example) can be used to determine the types of reciprocity within a group (perhaps accompanied with a fresh idea model).
  2. Translation of verbal results into visuals, so the value of direct feedback of group-reciprocity can be tested.
  3. Translation of visuals into consecutive series, so development of group cooperation (based on the five types of reciprocity) can be measured by comparing current visuals with previous ones.

The actions above need to be defined as research questions and interesting cases are to be defined.

[!] MOST IMPORTANT: Define how visualizing relationships will be about gaining perspectives, and not about creating a false feeling of control by detailled descriptions of relationships.

Personal notes for unraveling the ‘mist of reciprocity’:

ad 0: explore idea models

ad 1: The (relative) presence of each type of reciprocity appears by measurement of 5 parameters for every single (or for the top X of the total number of) relation(s)

ad 2: <creating a shared image of all interests (for both individuals and their backbones), defined by the presence/weight of each type …>

ad 3: <… translated into ‘to have a finger-on-the-pulse system available, to be used during collaboration in complex situations’>

Facebooktwitterlinkedinmail

Dealing with shadows, strings and schizophrenics

Three interesting issues are arising after some personal encounters. These issues offer potential for focussed, extensive interviews during the early stages of creating a base line:

  1. One suggestion (based on yet unpublished research) states that organisations don’t communicate themselves. It’s the employees / members / persons working in the name of these organisations who communicate. … Seems logic: this doesn’t really sounds like rocket science, does it?
    I’m wondering what research validates information sharing to be allways happening at the level of the individual, and not at the level of team or organisation.
  2. Another suggestion splits up personal and business interest. In collaboration activities very often the person ‘an sich’ is experienced as trustworthy. It seems however that -when working in between ‘the smaller part and the larger whole‘ – the individual is outshined (and/or bound to) by the larger whole and its intentions.
  3. And thirdly, officially there is never uncertainty whether a whether collaboration is based on PPS or clear ownership of an assignment (principal versus provider). Formally this isn’t the case of course. This raises the question why exactly complex systems tend to fail.

To me it feels schizofrenic when collaboration should to decrease entropy of the smaller part, with counter intuitive side effects on the larger whole, when dealing with complex systems. The other way around (counter intuitive side effects at the smaller part because of decrease in entropy of the larger whole) is also understandable.

Interviews and / or literature research are tools for answering the suggestions / questions above. Or at least for closing in.

I asume visual feedback provides an alternative for working in complex systems. Further reading on research like DiMicco‘s, will help validating the value of visual interventions. Its shortcomings included.
Perhaps an early intervention with student groups (see ideas for cases) could help define shortcomings of visual feedback of group collaboration (within a group).

I am especially interested in feedback between groups, not within a group. Therefore it’s worth exploring this:

1) Take a multidisciplinary case…
case

2) Where stakeholder relationships are defined…
stakeholders

3) and each individual has an organizational backbone…
organisational-backbones

4) With overlaping &/ interfering organizational agenda’s and intentions.
organisational-intentions

5) Why not take snapshots of relations and intentions in time…
snapshots

6) and transfer such a snapshots periodically into ‘the larger whole’ (the same snapshots to all parties), adapt backbone relationships and transfer adaptations back into the case.
transfer_snapshot-adapt_backbone-transfer_back

… most likely I need to split up this last image.

In other words, how could visualizaton of relations bring understanding of and to relationships. Relationships of individuals informing their organizational backbones with a uniform perspective of group relationships and intentions?

  • How could visualizations help transfer these relations and intentions, instead of steering content and knowledge?
  • Exactly which process criteria are necessary to strengthen group decision making when using visuals?
  • How can visualizations steer towards the intention of coopertion, when the going get’s tough?

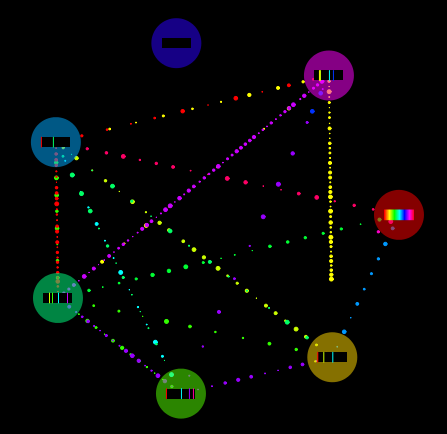
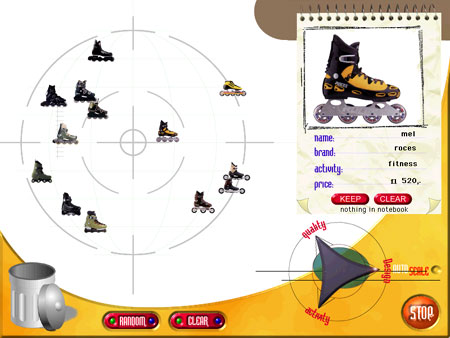
Feel free to play around with this inteactive sketch available at wereldopener.nl
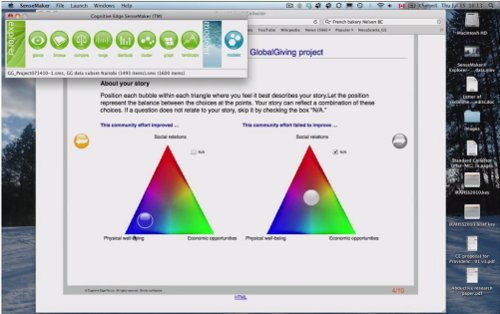
sketch

Facebooktwitterlinkedinmail